

Okay, so picture this: I’m troubleshooting a stalled token transfer at 2 AM and my feed of panic tweets is blowing up. I want facts. Fast. My instinct says “check the chain,” not Twitter. Solana moves quickly, and if you don’t have the right tools, things look worse than they are. I’m biased toward tools that give clear telemetry without the fluff. Solscan has become my go-to for that kind of quick, reliable clarity.
Solana’s throughput and sub-second finality change the game. They also change the questions you need to ask when something goes sideways. Was there a retry flood? Did a stalled program cause that downstream failure? Who are the top token holders for this mint right now? You need an explorer that surfaces those answers without a lot of clicking around. That’s where solscan fits into my workflow.
When I say “fit,” I mean practical stuff: transaction timelines, program logs, per-block summaries, and token-holding distributions. Not just a nice UI. The difference shows up when you actually need to debug or audit an on-chain event, and speed matters. Solana’s architecture rewards fast reads; your tooling should match that pace.
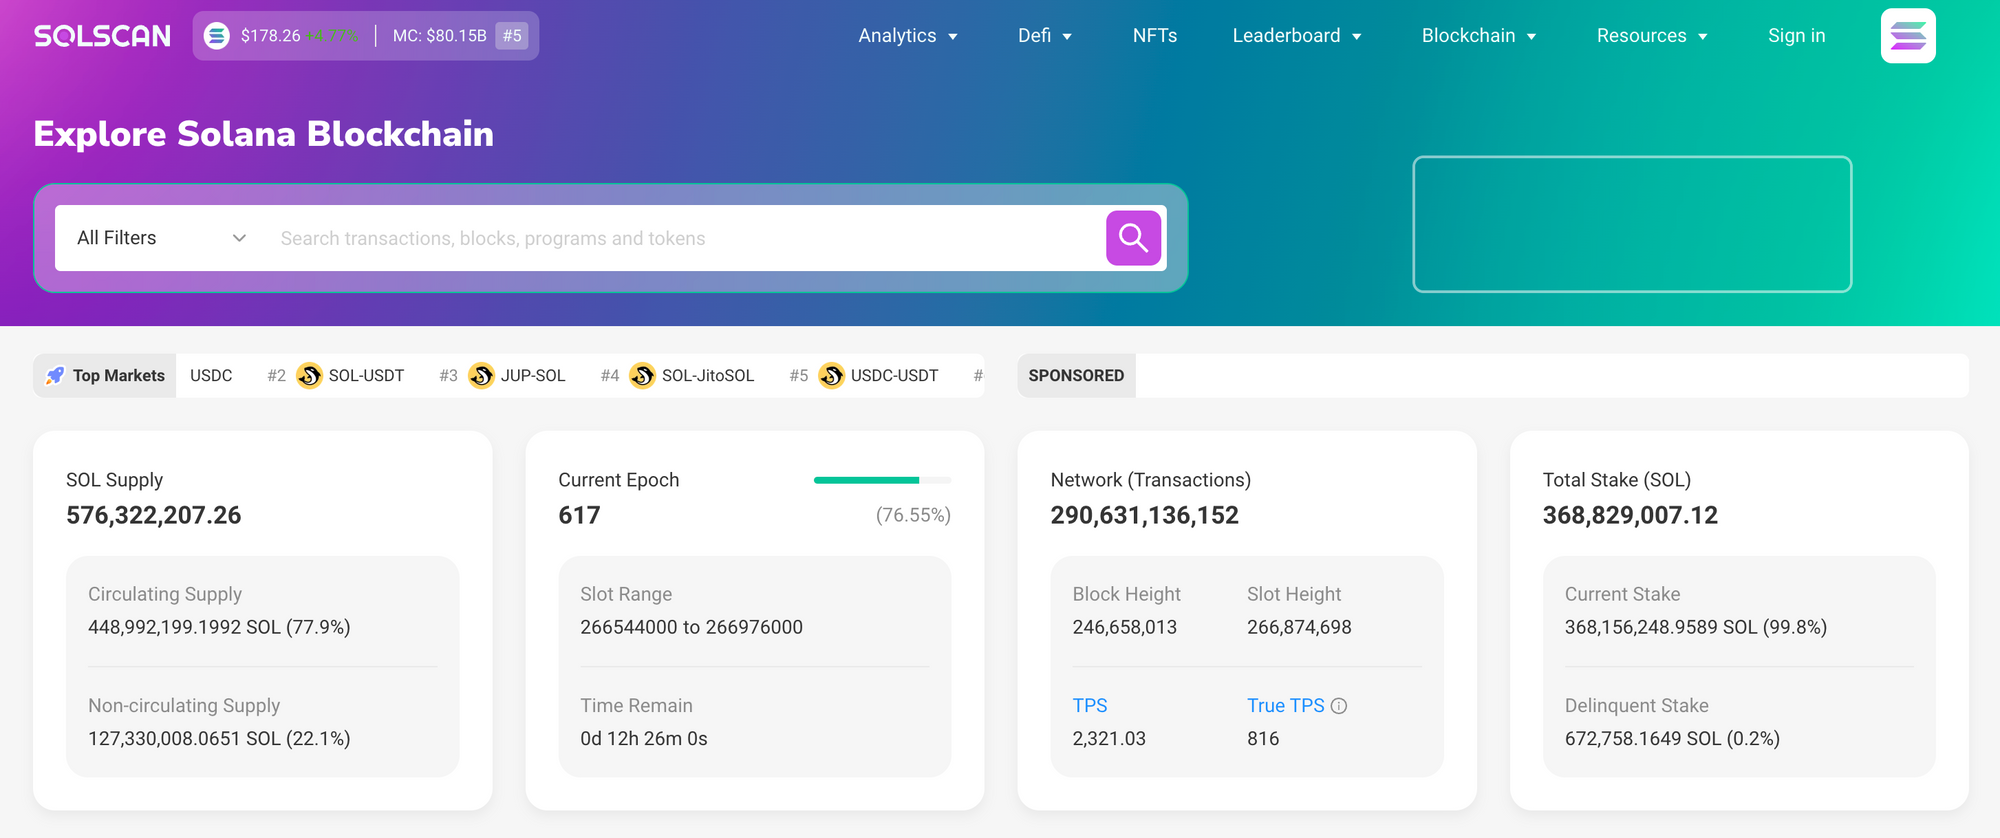
What good Solana analytics actually do
Analytics for Solana isn’t just about pretty charts. It’s about operational visibility. You want to know whether a transaction failed because of an account size mismatch, a missing signatory, or a runtime fault in a deployed program. You want the mint history of a token, not just the current supply, and you want to see how liquidity and holders change over time. Good analytics answers those questions quickly—so you can act and not just react.
Here’s what I look for:
- Readable, timestamped transaction logs that tie to on-chain programs.
- Token holder breakdowns and transfer histories for wallets and mints.
- Block summaries and slot details when forks or replay events are in play.
- Searchable program interactions so you can trace how a contract behaves across calls.
- Exportable data. CSVs. JSON. Give me the raw data when I need to run my own analysis.
Solscan ticks most of those boxes. It isn’t the only tool—nothing is—but it’s a robust, all-purpose explorer that blends transaction inspection with higher-level analytics in a way that feels useful in the field.
Digging in: practical workflows I use with Solscan
Scenario one: a user reports a failed swap.
First, paste the transaction signature into Solscan. I scan the status—success, fail, or simulated error. Then I open the program logs. Those logs usually show whether the failure was due to insufficient funds, a constraint in the program’s CPI calls, or an account not being initialized. Ten seconds. Problem narrowed. Ten minutes. Root cause usually identified.
Scenario two: a token looks weird—sudden spikes in transfers, unclear tokenomics.
I go to the token’s mint page. Holder distribution, top wallets, historical transfers. If a single whale moved a huge chunk, you’ll see it. If a mint authority minted out more tokens, that’s visible too. That context changes the conversation with users and stakeholders immediately.
Scenario three: on-chain performance questions.
Solscan’s block and slot views help here. Are there a bunch of transactions failing in the same slot? Is there an unusual retry pattern from a bot? I use the slot history to check patterns across time. Sometimes the issue is network congestion; sometimes it’s a bot doing way too many CPI calls.
Why explorer UX matters more on Solana
Solana’s model pushes volume. That means searches return long lists fast. If your explorer makes you click ten times to get a log or shoves data behind collapsed panes, you’re wasting time. Solscan’s design tends to favor immediate visibility: logs are inline, token metadata is easy to view, and the UI highlights program call failures without hiding them.
That said, nothing is perfect. Some program logs can be dense, and you still need a mental model to understand cross-program invocations (CPIs). Solana’s composability is a huge advantage, but it also means that one transaction can touch many programs, each with its own logic. An explorer can show you the calls, but interpreting them still requires some expertise.
Navigating limitations and verification
I’ll be honest—explorers are viewers, not authoritative judges. They read what RPC nodes serve them. If you’re verifying an event for legal or high-stakes reasons, you still want to cross-check multiple RPC providers or run your own validator for the ultimate source of truth. Solscan is fast and reliable, but it’s a layer above the nodes. Use it as your eyes, not your oracle.
Also, watch out for metadata and off-chain links: not everything in a token’s metadata is verified on-chain. A listed website or image can be spoofed if the metadata points to mutable off-chain resources. I always check whether the metadata is rooted in on-chain immutability or dependent on IPFS pinned content.
Comparisons—where Solscan sits among tools
There are specialized analytics stacks that do deep on-chain analysis—token flow heatmaps, ownership graphing, and behavioral anomaly detection. Those are great for forensic work. Solscan is broader: it covers explorer basics plus nice-to-have analytics without pushing you into an expensive analytics suite. For most everyday tasks—transaction triage, quick audits, token checks—it’s the sweet spot.
For teams doing large-scale monitoring, Solscan pairs well with dedicated dashboards or a local analytics pipeline. Pull CSVs or use their APIs alongside your monitoring tools for alerting and automated compliance checks.
Common questions I get
How accurate is the data on Solscan?
Quite accurate for day-to-day use. It reads from Solana RPC nodes and presents parsed logs and token data. But remember: explorers aggregate node data. For final verification, consult multiple RPCs or your own validator. Solscan is a reliable secondary source, ideal for diagnostics and investigations.
Can Solscan help with token holder audits?
Yes. The token pages show holder distributions and transfer histories. You can export holder lists for further analysis. That said, if you’re doing a legal audit or an audit that requires immutable proof, couple the explorer output with on-chain snapshots from a trusted RPC or your archival node.
Is Solscan good for NFT investigations?
It’s useful. You can trace mint history, ownership transfers, and associated metadata pointers. But NFTs often rely on off-chain media, so confirm the metadata pinning and whether any centralized services host the content you care about.
Solana analytics isn’t magic. It’s the combination of a fast chain, clear telemetry, and a curious operator who knows what to look for. Tools like Solscan don’t replace expertise, but they make that expertise far more effective. If you’re building on Solana or just trying to keep your users supported, having a practical explorer in your toolkit is a must. It saves time, cuts drama, and gives you the facts you need to move forward.